Voting patterns on London’s city council, 2018–2022
Five key takeaways
- van Holst and Hillier, who were outliers and more contrarian in the first three years of the term, have shifted to voting with the majority much more frequently.
- Newly-appointed councilllors Hamou and Fyfe-Millar have joined Lewis, Morgan and Lehman in a very tight group of five that votes together on non-unanimous votes. These two new councillors are voting virtually in lockstep on non-unanimous votes (~96% of the time), unlike the councillors they replaced (who only voted yes together ~70% of the time).
- On non-unanimous votes, Holder is much less likely to be voting yes together with Helmer (me) since the new councillors were appointed, going from 79% to 63.5%.
- Holder is voting yes with Hamou and Fyfe-Millar roughly 90% of the time, unlike Squire and Kayabaga, where he was voting yes with them ~70% of the time.
- The Morgan group has a remarkably high success rate on motions where there is disagreement on council, ranging from Lehman (83%) to Fyfe-Millar (97%, on a much smaller number of total votes) and Morgan at 92%.

From 2010 to 2014, London had a Mayor, Joe Fontana, who governed with a slim 8-person majority, known as the Fontana 8. After Fontana was convicted of breach of trust and resigned, the councillors from this group who sought re-election were defeated. An analysis of the following 2014–2018 council, undertaken by Mike Ross, did not reveal such strong factionalism.
What about the current council? One way of analysing voting patterns is to see how often councillors agree with each other. We can do this by extracting the voting records from the minutes of each meeting and analysing the recorded votes on each motion. For the 2018–2022 council, until early Sept 2022, there are 5,370 motions. Many votes cover more than one motion (for example, several items from a committee report voted on together).
Two councillors, A. Kayabaga and P. Squire, resigned partway through their terms. Let’s look at the original group of councillors who were elected (until the last vacancy was filled in Nov 2021). There are 4,271 motions to analyze.
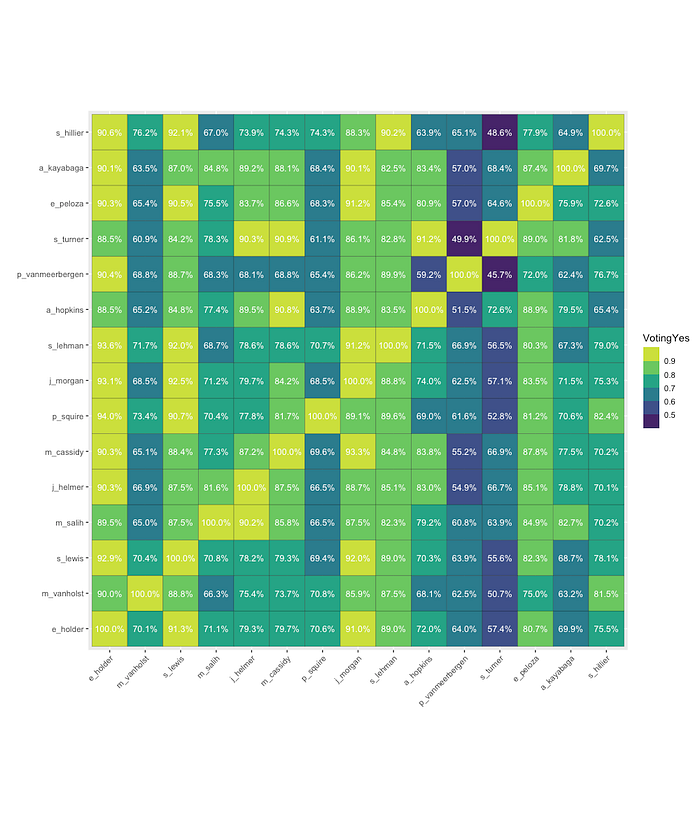
In terms of how to read this plot, the colours give a general sense of how frequently a pair of councillors are voting yes together. Read from left to right across the graph for a member of council you are interested in.
The highest possible value is 100%. The value of “not yes” includes no, recuse and absent.
Voting Yes, by councillor, Dec 2018 to Nov 2021

Generally, councillors are voting yes with each other. This is not surprising, as we are considering all motions, including routine and uncontroversial motions. There are a lot of these motions, so we would expect to see a high degree of agreement. The lowest values are aroud 83%. But we are starting to see some patterns already.
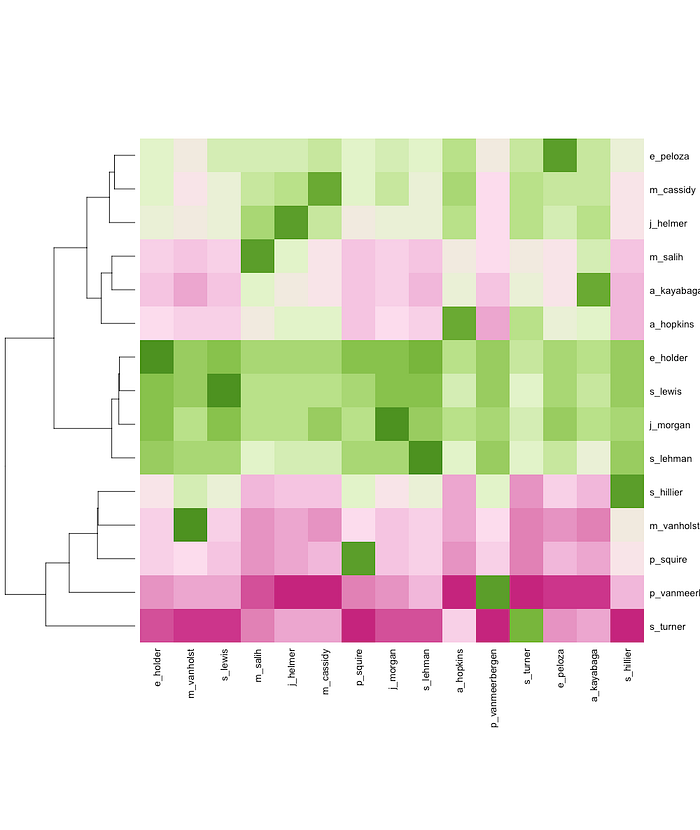
We can order the data to see patterns more clearly. Here’s a heatmap where the columns are in ward order but the rows have been clustered. The tree graph on the left is a dendrogram, showing how the hierarchical clusters are organized.

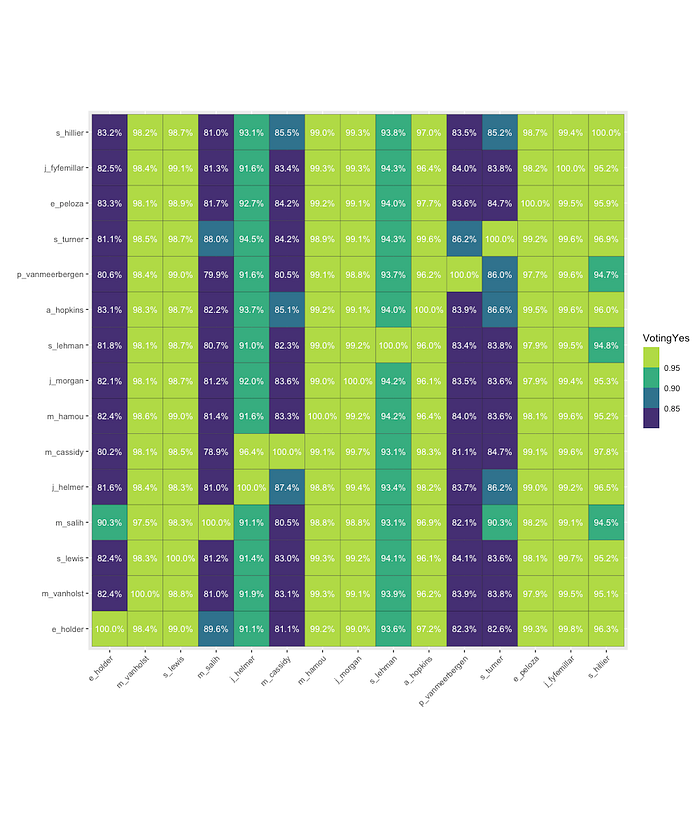
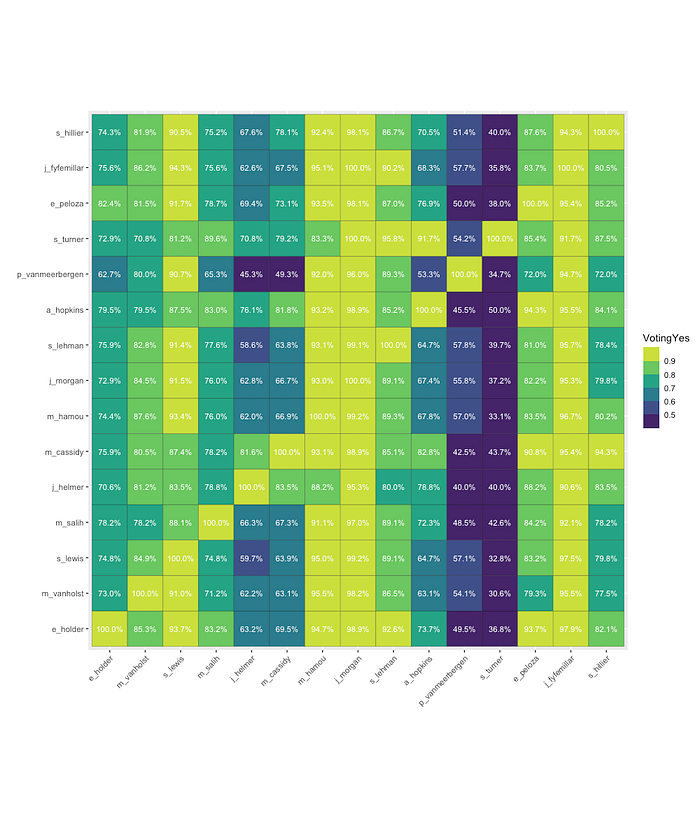
Voting Yes on Motions with Opposition, by councillor, Dec 2018 to Nov 2021
Let’s take a look at only the motions where there was a divided vote at council — someone voted against the motion. From Dec 2018 to Nov 2021, there are 521 such motions with opposition.
Now we are starting to see some more interesting patterns. Look for yellow green or light green for high levels of agreement. Reading from left to right, let’s pull out the highest and lowest levels voting yes together.
Mayor Holder: highest, Lewis and Morgan; lowest, Turner.
van Holst: highest, Holder and Lewis; lowest, Turner.
Lewis: highest, Holder and Morgan; lowest, Turner.
Salih: highest, Helmer (me) and Holder; lowest, Van Meerbergen.
Helmer (me): highest, Holder and Cassidy; lowest, Van Meerbergen.
Cassidy: highest, Morgan and Holder; lowest, Van Meerbergen.
Squire: highest, Holder and Lewis; lowest, Turner.
Morgan: highest, Holder and Lewis; lowest, Turner.
Lehman: highest, Holder, Lewis and Morgan; lowest, Turner.
Hopkins: highest, Cassidy, Helmer, Peloza, Holder; lowest, Van Meerbergen.
Van Meerbergen: highest, Holder, Lehman and Lewis; lowest, Turner.
Turner: highest, Hopkins, Cassidy, Helmer; lowest, Van Meerbergen.
Peloza: highest, Morgan, Lewis and Holder; lowest, Van Meerbergen.
Kayabaga: highest, Holder and Morgan; lowest, Van Meerbergen.
Hillier: highest, Lewis, Lehman and Holder; lowest, Turner.
Again, we can look for patterns by clustering the data.
A fairly tight grouping of Morgan, Holder, Lehman and Lewis, who are voting yes together frequently is quite clear, with a less cohesive but larger group of Peloza, Cassidy, Helmer, Salih, Kayabaga and Hopkins and a series of contrarians and more independent types in Hillier, van Holst, Squire, Van Meerbergen and Turner.
Voting Yes, by councillor, Dec 2018 to Nov 2021
Now, let’s look at the motions voted on after vacancies were filled in Wards 6 and 13. How did things change when new councillors were appointed in those two wards in late 2021?
Generally, the level of agreement is still quite high, although some members of council appear to have shifted to voting yes less frequently. Interestingly, the new councillors, Hamou and Fyfe-Millar, have nearly identical voting patterns.
How does this look when clustered?
Quite a change from the previous three year period! van Holst and Hillier, for example, have moved from being relative outsiders to a high level of voting yes with other councillors. Keep in mind that this covers 1,099 motions rather than the 4,274 motions in the earlier time period.
Voting Yes on Motions with Opposition, by councillor, Nov 2021 to Sept 2022
Let’s focus again on just motions where there was disagreement. There are only 116 motions in this ~10.5 month period.
There seems to be stronger disagreement. Let’s focus on the newly-appointed councillors.
M. Hamou: highest, Morgan, Fyfe-Millar and Lewis; lowest, Turner.
Fyfe-Millar: highest, Morgan (exactly 100%!), Hamou, Lewis, Lehman; lowest, Turner.
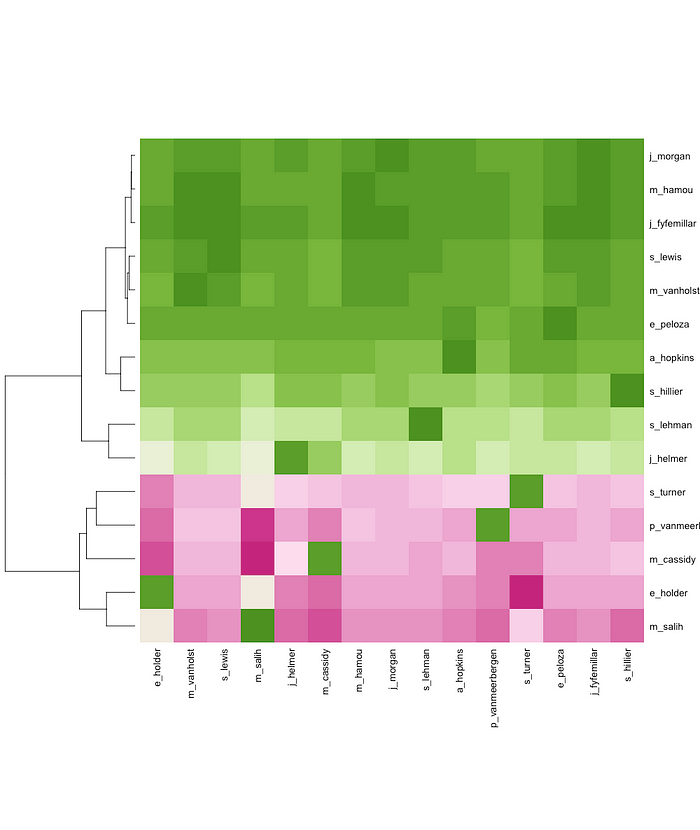
Let’s cluster to see if the patterns are clearer.
The tightest group has grown slightly with the addition of the newly-appointed councillors (Morgan, Lewis, Lehman, Hamou, Fyfe-Millar) and there is a another group of five that is slightly less consistent.
Which councillors are voting with the majority most often?
Another way of analyzing voting patterns is to look at how often a councillor is voting with the majority. You can read an overview of Mike Ross’ analysis of the 2014–2018 council here. The highest win rate during that term of council was Mayor Brown (92%).
The table below shows the winning percentage of each councillor on divided votes. Winning means voting “Yes” on a motion that passed and voting “No” on a motion that failed. Because of the resignations and appointments, the denominator for those four councillors is different from the other members of council.
